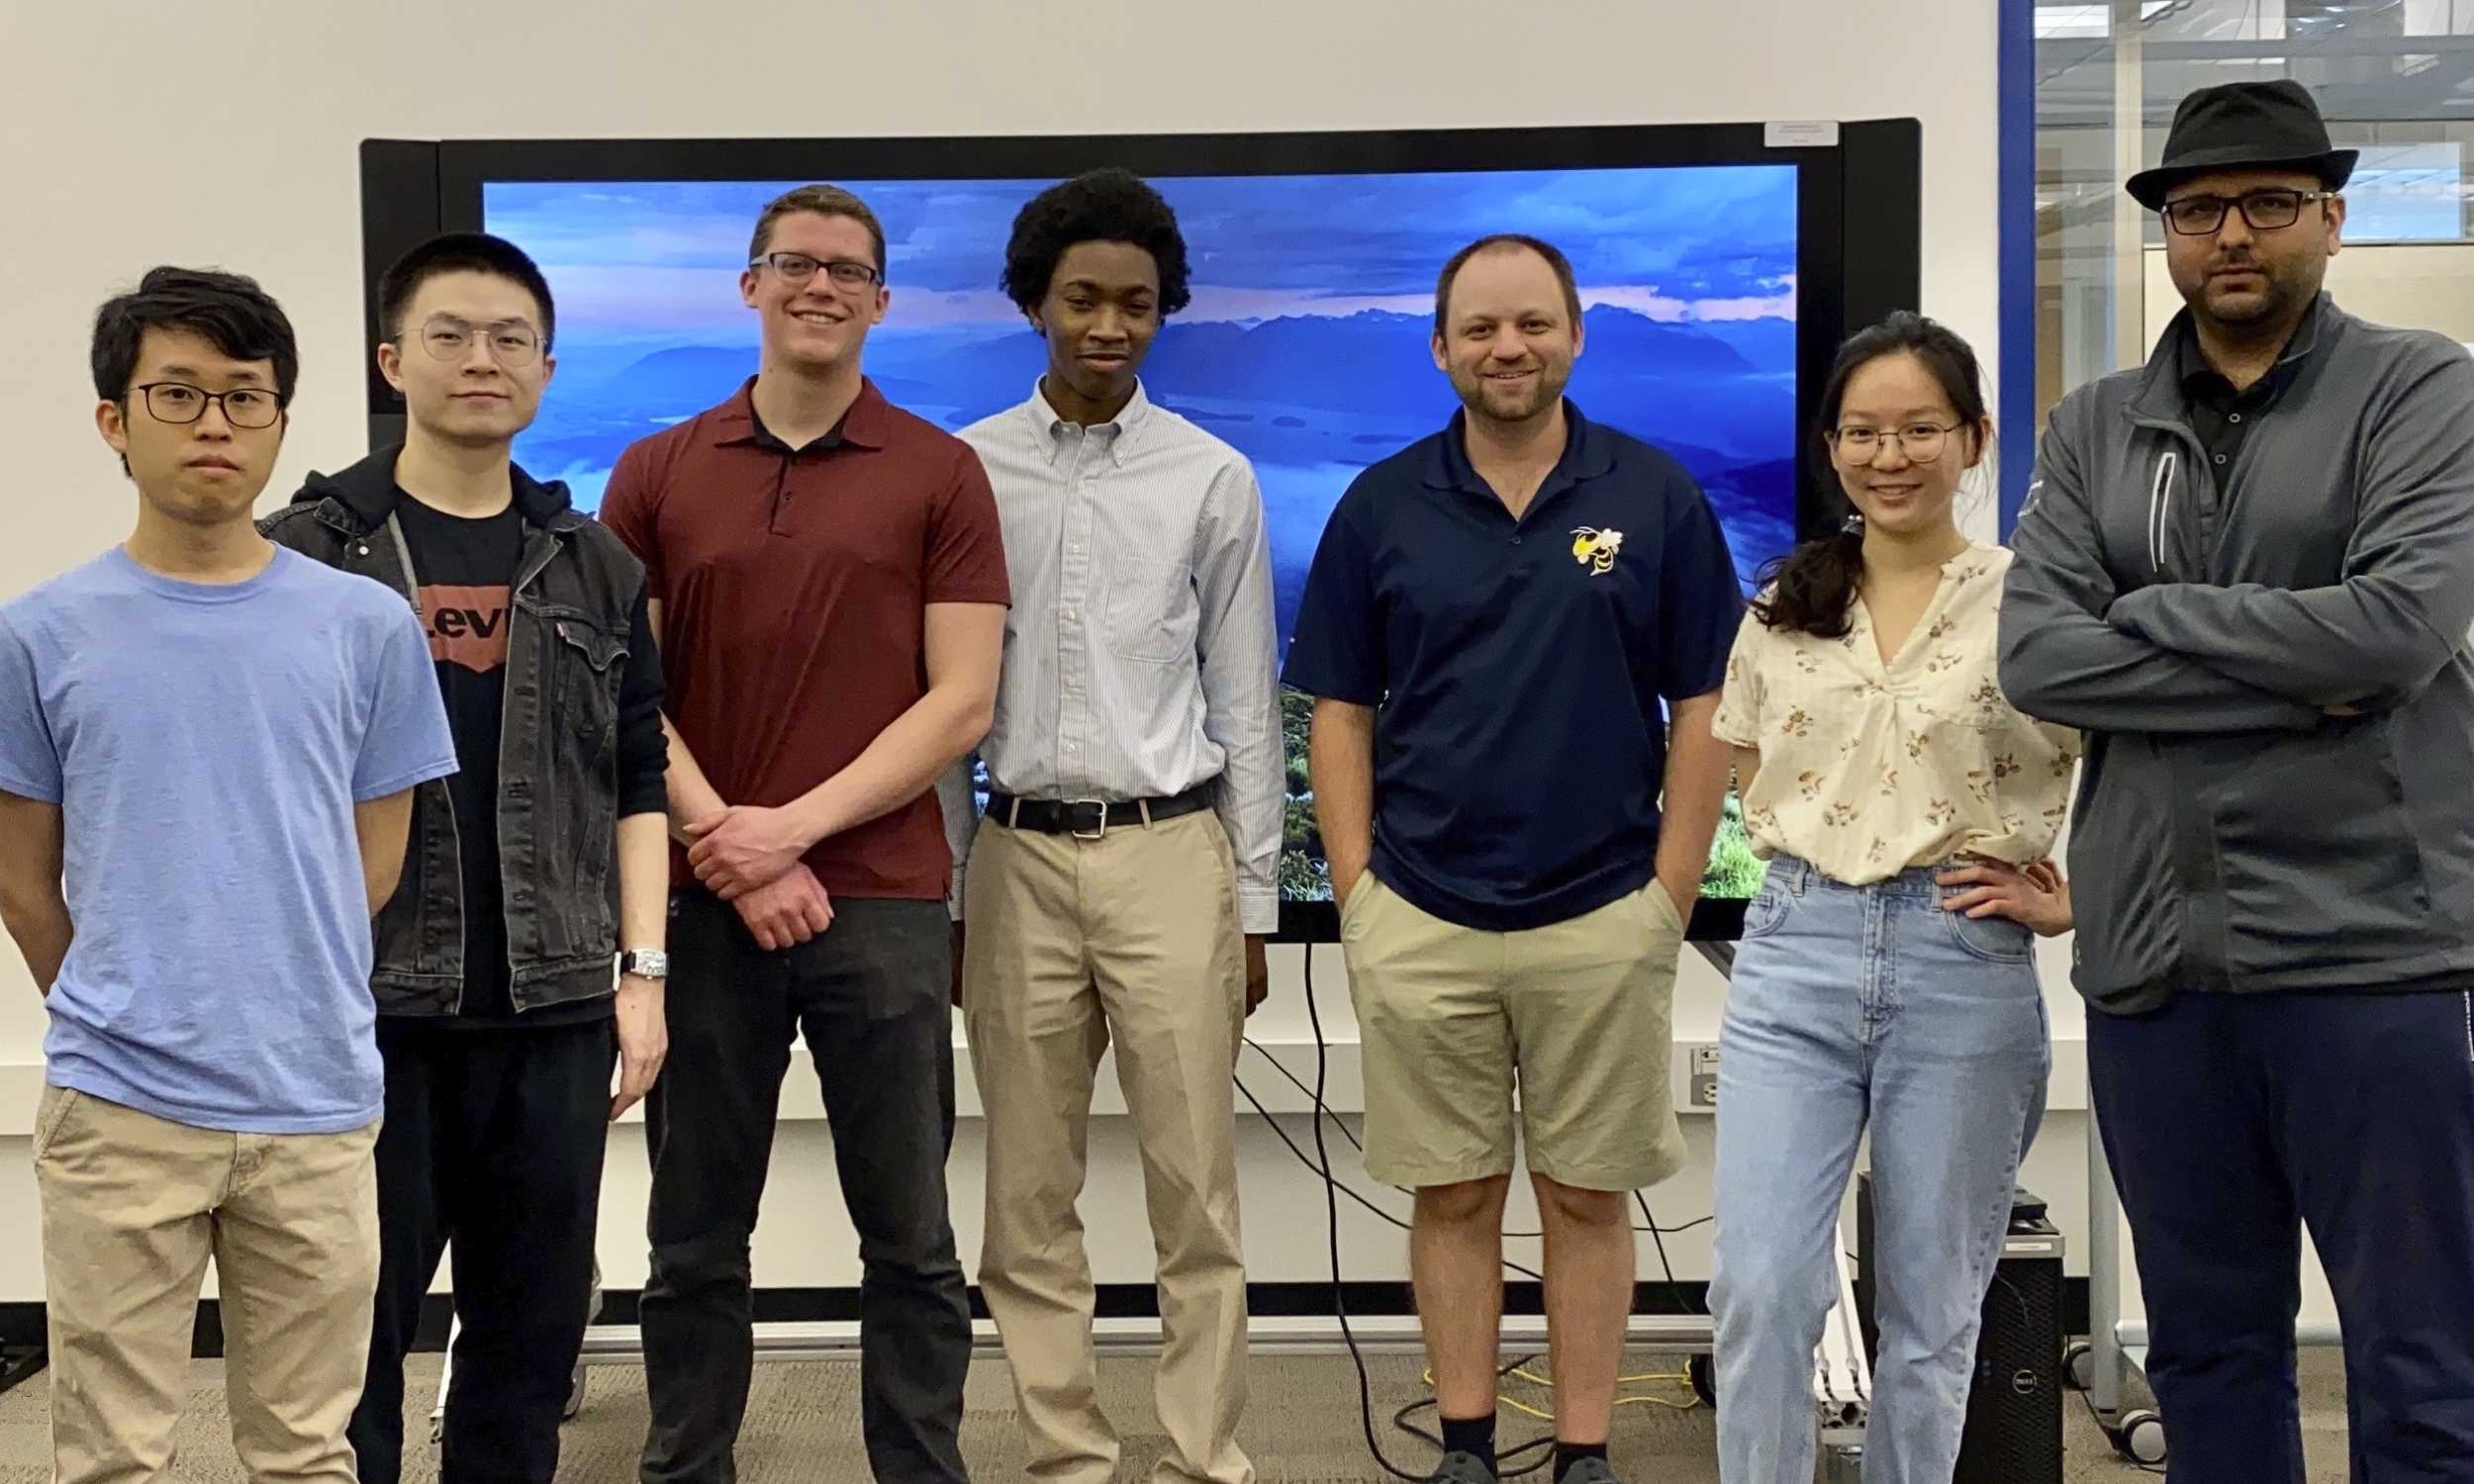
Our Groups
The team is made up of six groups that lead visualization research in Information Visualization, Visual Analytics, Geographic Information Systems, Visual Perception, Immersive Visualization, and Visual Data Science.
We conduct experiments to understand how humans interpret data and make decisions using visualizations, generating guidelines for visualization tools that help people more effectively explore and communicate data.
Featured Projects:
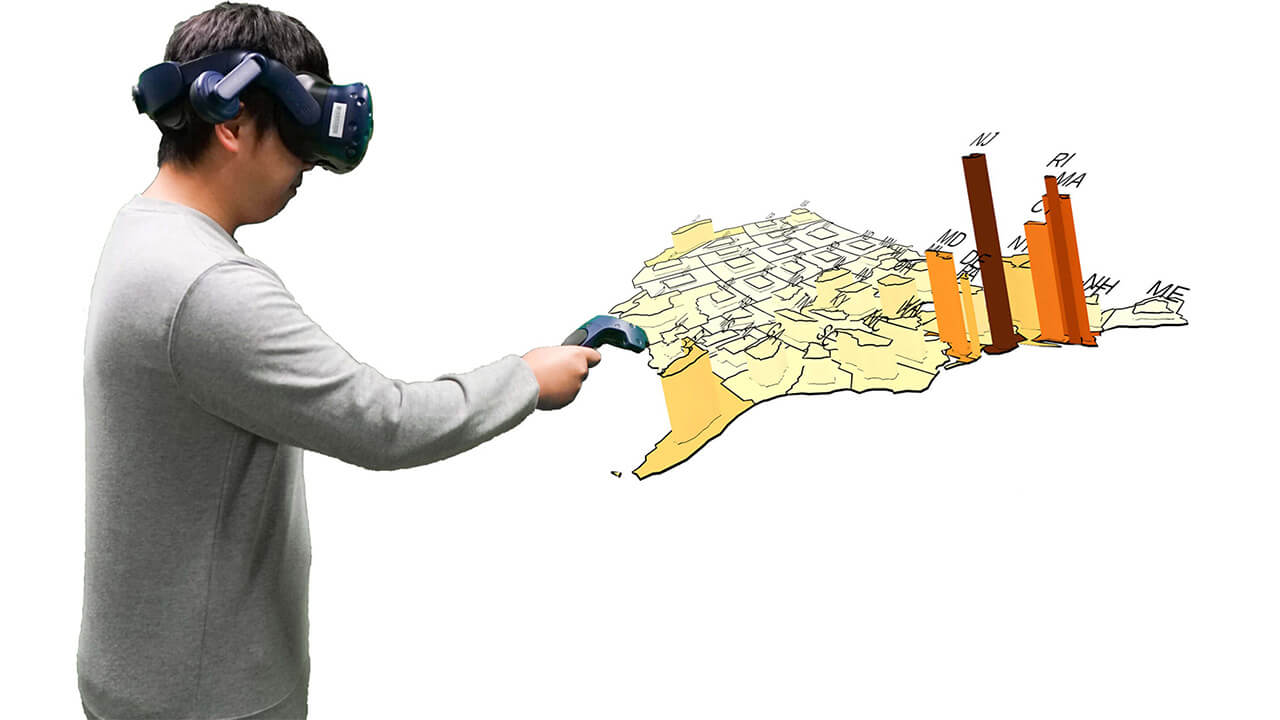
With VR/AR becomes increasingly popular, we envision a future where these technologies seamlessly integrate into both personal and business domains. To contribute this exciting future, we study how to harness the full potential of VR/AR to enhance existing workflows and to unlock new experiences that were once unimaginable with conventional computing devices.
The research group led by Clio Andris within the School of City & Regional Planning and School of Interactive Computing at Georgia Tech. We develop new mapping strategies for modeling social life, livelihoods, and interpersonal relationships in geographic space.
Featured Projects:

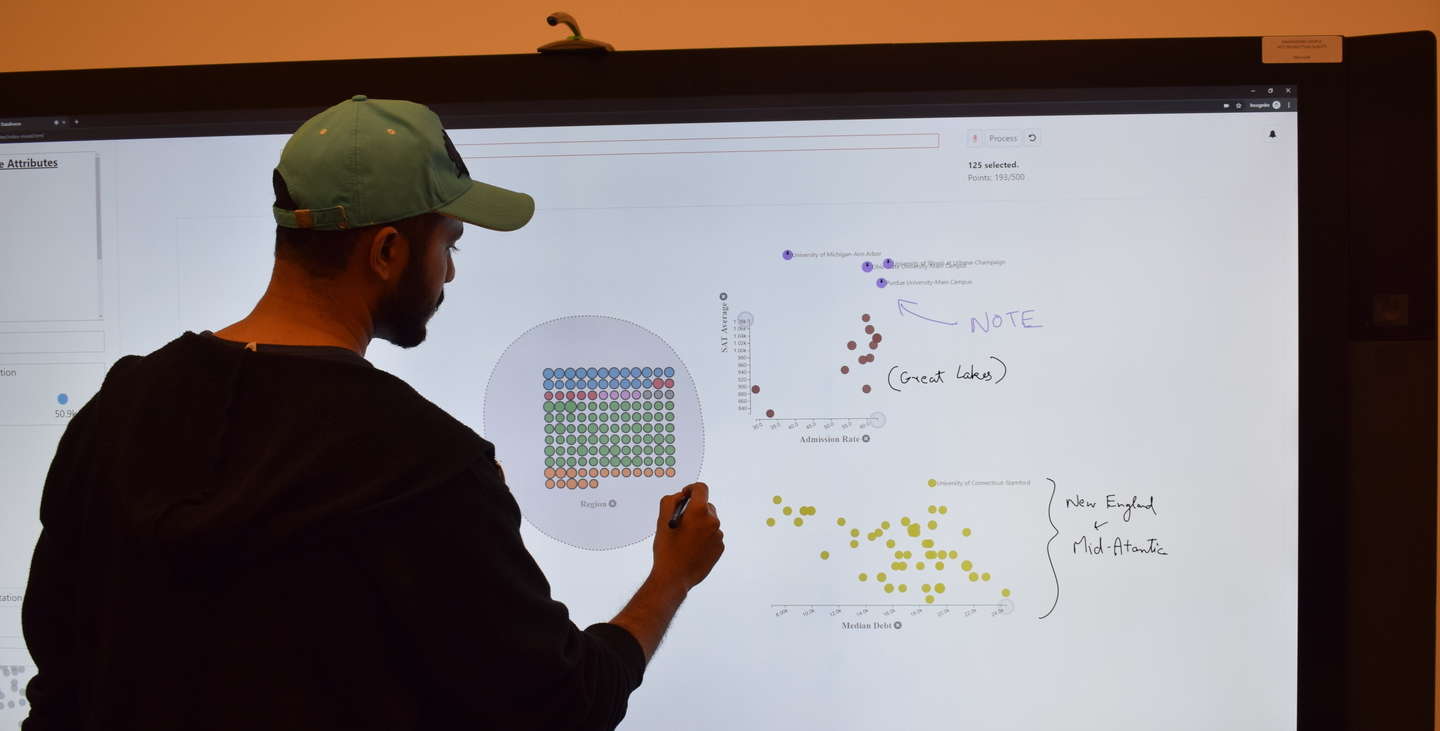
At the Visual Analytics Lab, led by Alex Endert, we research and develop interactive visual analytics applications that help people make sense of data. We approach this challenge through combining scientific techniques from information visualization, machine learning, data mining, and human-computer interaction to produce usable and powerful visual analytics applications.
Featured Projects:
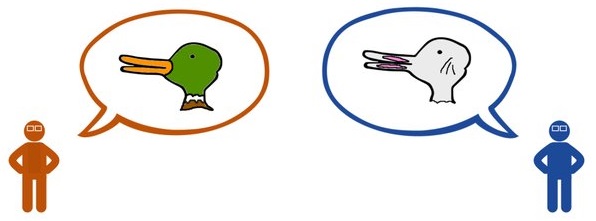
At the Polo Club of Data Science, led by Polo Chau, we innovate scalable, interactive, and interpretable tools that amplify human’s ability to understand and interact with billion-scale data and machine learning models. Our current research thrusts human-centered AI (interpretable, fair, safe AI; adversarial ML); large graph visualization and mining; cybersecurity; and social good (health, energy).
Featured Projects:
The Information Interfaces Group, led by John Stasko, applies information visualization and visual analytics techniques to help people better analyze, understand, and present data sets and document collections.
Featured Projects: